

The Dashboards in the Asset Management application offer a detailed and real-time view of your organization’s assets. They provide an overview of both Physical and Non-Physical Assets, along with a comprehensive summary of Asset Requests. Also, they represent the details such as the number of assets, vendors, manufacturers, and the volume of asset requests. The dashboards include visual graphs showing asset request trends over the last three months, enabling you to track patterns and make data-driven decisions. These features ensure a clear and organized view of your organization’s assets and requests, helping you manage resources efficiently.
1. Physical Assets Overview Dashboard
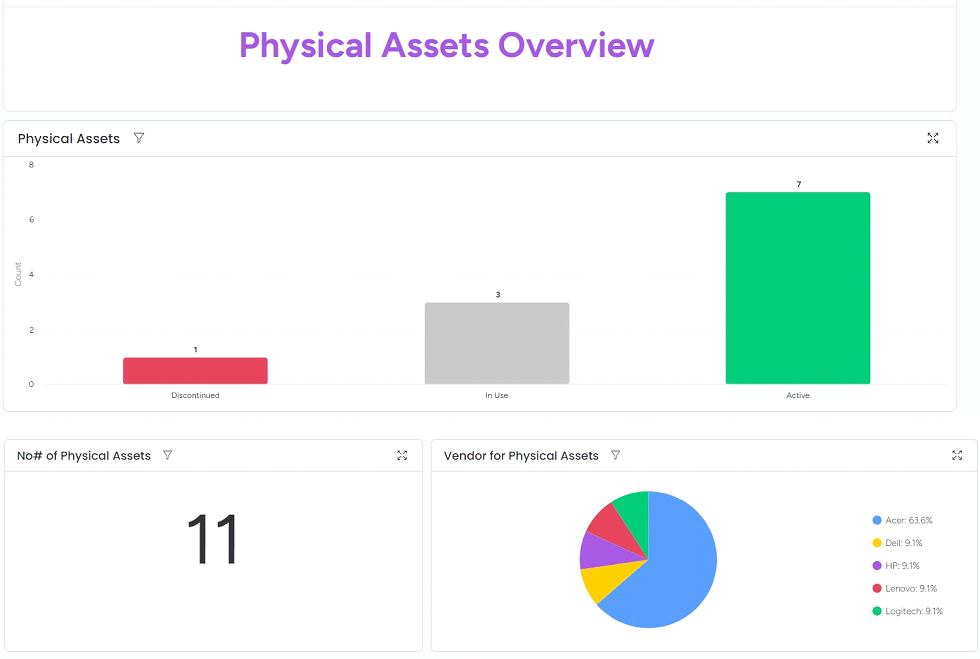
Physical Assets: Displays the number of physical assets categorized by their status, including those currently Active, In Use, and Discontinued.
No# of Physical Assets: It shows the total number of Physical Assets.
Vendor for Physical Assets: Displays the vendors name who are supplying physical assets to your organization.
2. Non-physical Assets Overview Dashboard
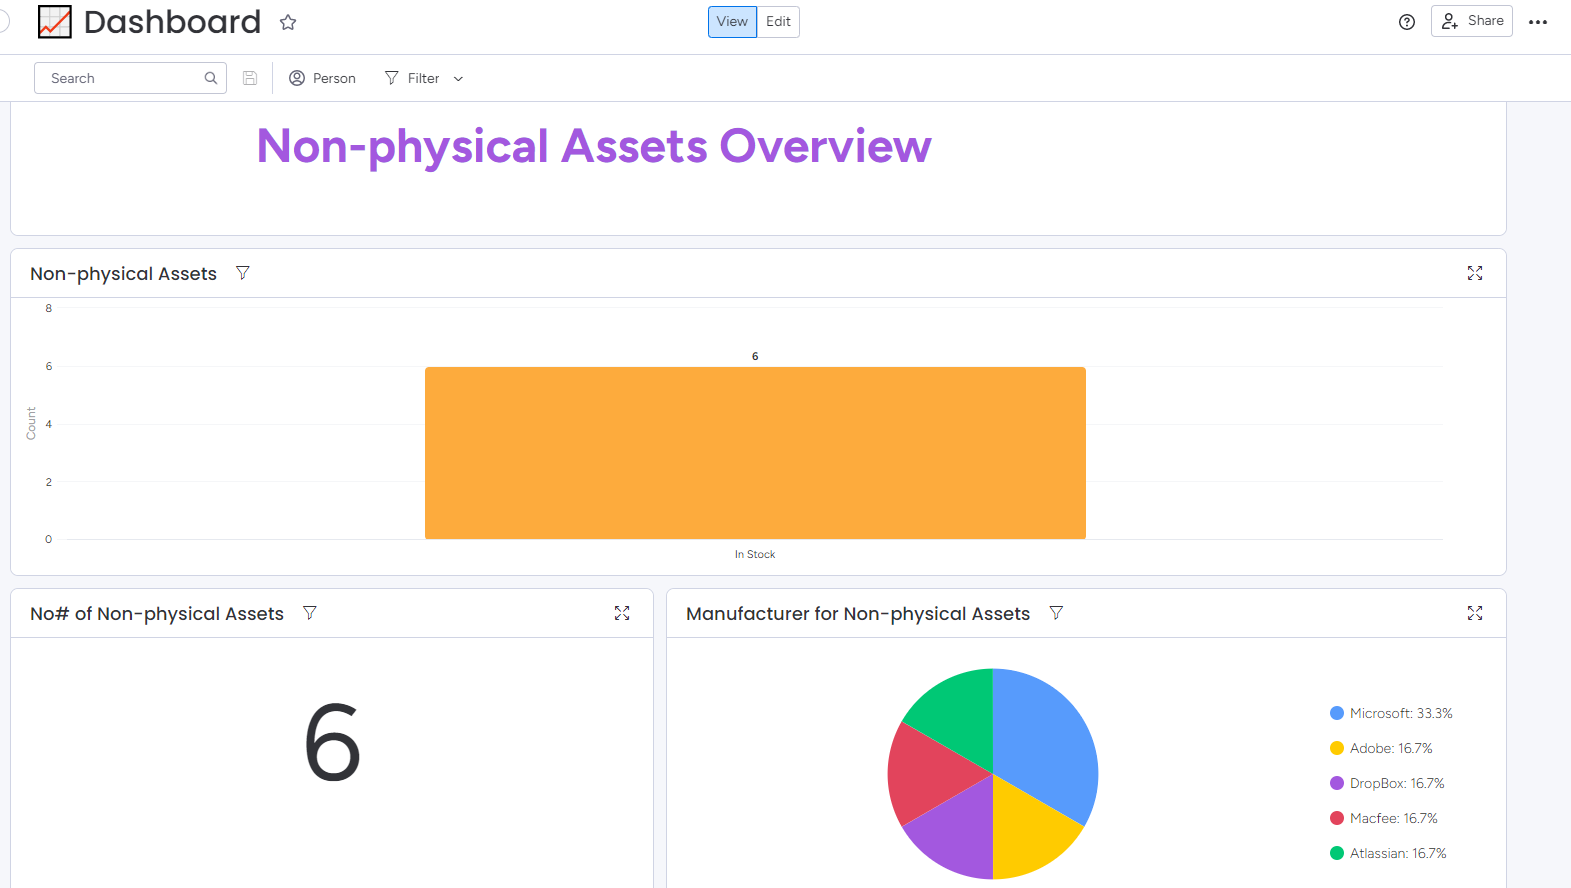
Non-Physical Assets: Displays the number of non-physical assets categorized by their status, including those currently In Stock, In Use, and Expired.
No# of Physical Assets: It shows the total number of Non-Physical Assets.
Manufacturer for Non-Physical Assets: Shows the names of manufacturers supplying non-physical assets to your organization.
3. Asset Requests Overview Dashboard
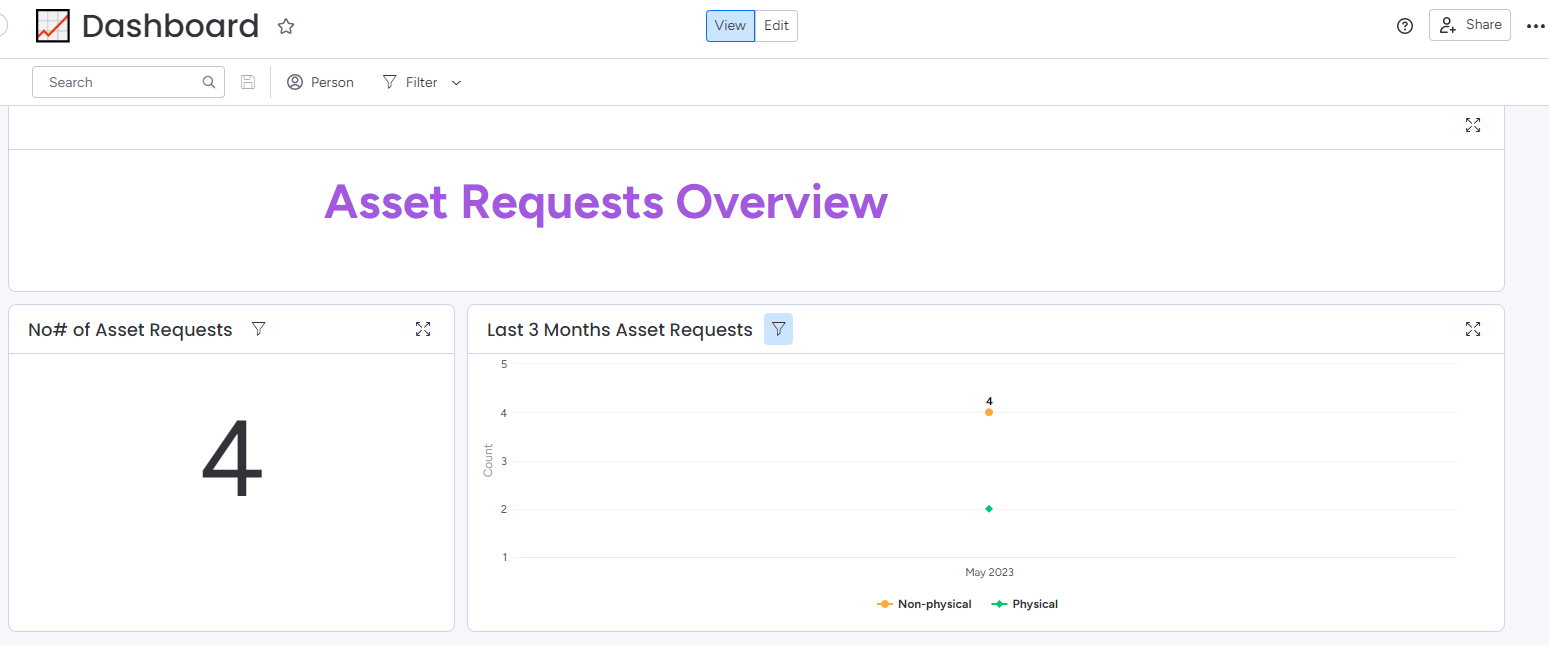
No# of Asset Requests: Displays the total number of asset requests submitted within the organization.
Last 3 months Asset Requests: Provides a summary of asset requests made in the past three months, helping track trends and manage asset requests over time.